Table of Contents
What does a data analyst do?
A data analyst collects and stores data and brings technical expertise to ensure the quality of that data. Then they design and process it to help businesses make better decisions.
So it shouldn’t surprise you that the average salary for a data analyst is over $70,000.
Today we’re looking at the best data analysis courses this year so you can kickstart your career.
This post contains affiliate links. I may receive compensation if you buy something. Read my disclosure for more details.
TLDR: Best Data Analysis Courses
🔥 Best Overall 🔥
Data Analysis in Excel: DataCamp
💥 Best for Newbies 💥
Complete Machine Learning and Data Science: Zero to Mastery
💸 Best Value 💸
Python Data Analysis and Visualization Learning Path: Educative.io
Best Data Analysis Courses
1. Python Data Analysis and Visualization Learning Path: Educative.io
It’s no surprise that yet another Educative.io creation has topped our list of best data analysis courses.
Python Data Analysis and Visualization is actually a Learning Path. So instead of one course, there are four courses:
- Data Analysis and Visualization
- From Python to NumPy
- Data Analysis & Processing with pandas
- Visualization using Matplotlib for Python
And by using various Python libraries, you’ll be able to extract insights from data.
💡 Python is a highly-readable programming language. It saves you time because you write fewer lines of code.
Learning Path Layout
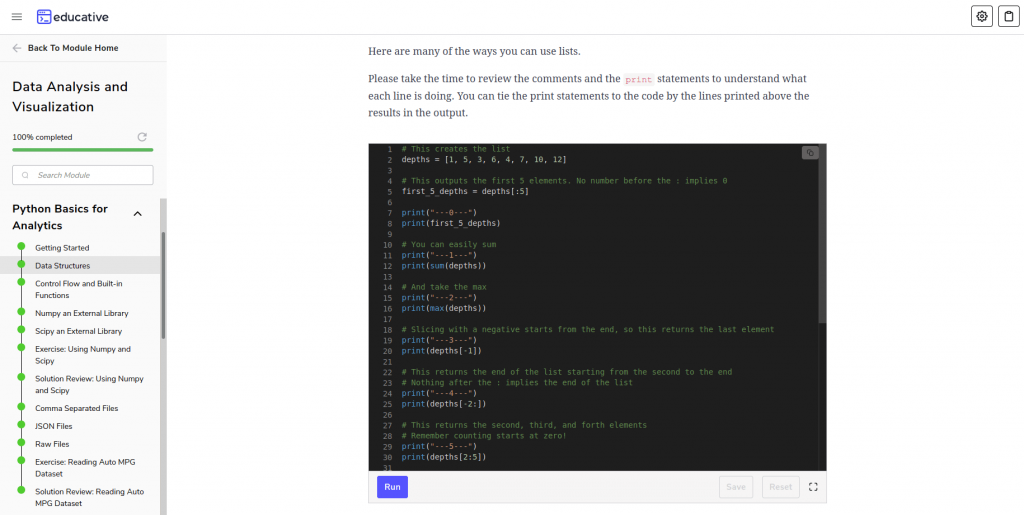
Educative.io has an interactive learning environment. This means that you’ll do all work inside the browser using over 300 coding playgrounds.
In addition, there are over 200 code snippets to illustrate concepts.
The left hand side contains the outline, and the center of the screen contains the lesson you’re working on.
In this learning path, you’ll discover how to extract and represent data with:
- Python data structures
- statistics
- exporting data
And beyond.
You’ll also learn how to represent data in NumPy, a Python library.
In addition you’ll explore pandas, another Python library. You’ll use it to clean, extract and process data.
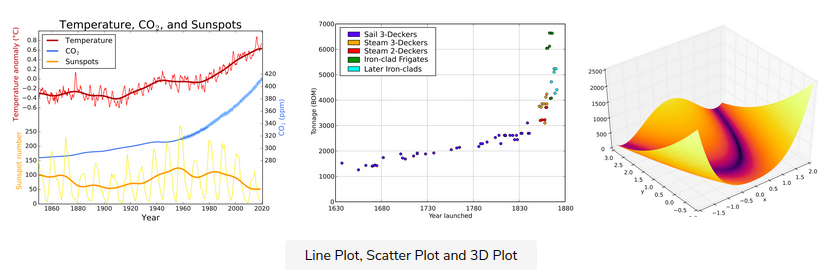
Finally, you’ll learn how to use Python libraries like Matplotlib for data visualization.
Projects
There are no projects in the Python Data Analysis and Visualization Learning Path.
But there are 12 brain-teasing challenges you’ll work on throughout the course.
Community
While there is no official Educative.io community, each course has an area where you can get help from other students and instructors.
💰 Price: $59 per month or $199 per year ($16.66/mo) for access to all courses and Learning Paths
⏲️ Duration: 16 hours
📉 Level: Beginner
🖥️ Format: Interactive Learning
🎖️ Certificate: Yes
Want to know what we think of Educativeio? Read on to find out Is Educative Worth It?
2. Data Analysis in Excel: DataCamp
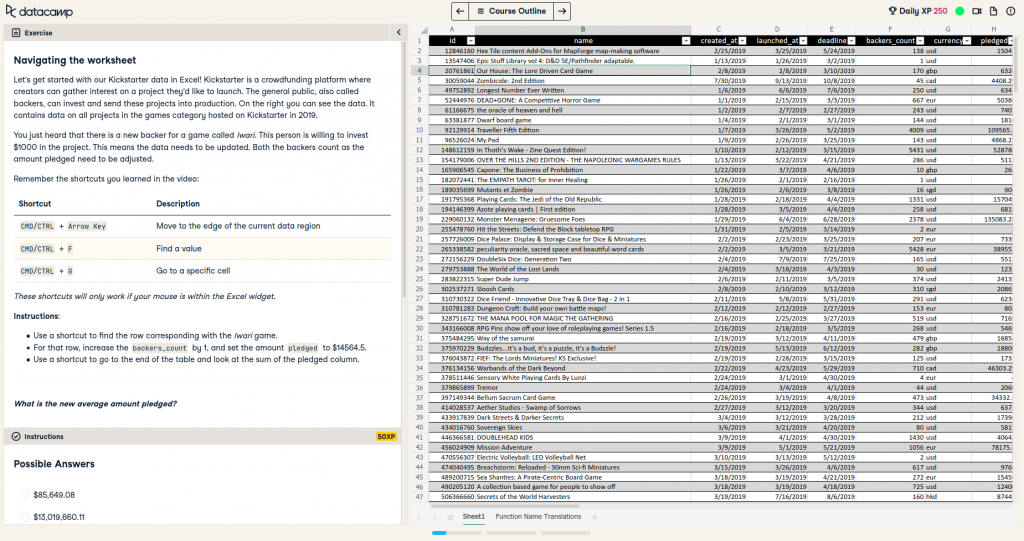
Excel isn’t just for geeky dads anymore. And if you thrive on exercise-heavy courses, Data Analysis in Excel might be just the course for you.
Data Analysis in Excel is a course to teach you how to analyze data in Microsoft Excel. With Excel, you can transform raw data into clear insights.
In this course, you’ll develop analyst skills that will make you more appealing to employers. You’ll learn about keyboard shortcuts and converting data types as you progress.
In total, you’ll learn over 35 core Excel functions such as:
- Concatenate
- VLookup
- Averageif(s)
And you’ll do it all while working with real-world Kickstarter data.
💡 Kickstarter is a creativity-based crowdfunding platform. It’s used by musicians, artists, photographers, game developers and others.
Course Layout
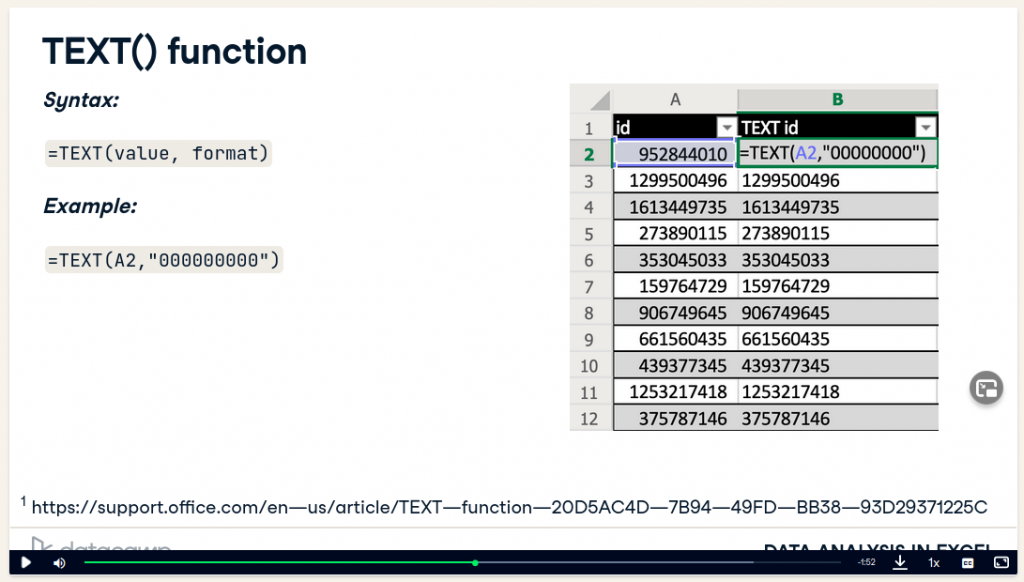
DataCamp is an interactive learning platform, meaning you’ll do all work inside the browser. In addition, you’ll find occasional videos to introduce or clarify concepts.
It’s also a gamified learning environment, meaning you get points and ranking for every lesson and quiz you complete. 🎮
Data Analysis in Excel is separated into three modules.
The first module is dedicated to exploring data. Here you’ll work on:
- setting up your environment
- exploring data in Excel
- trimming your data
- understanding data types in Excel
And much more.
Then, you’ll move onto the second module which focuses on preparing data. You’ll learn how to:
- clean data
- extract text from cells
- prepare data
And beyond.
Finally, you’ll learn all about analyzing data. Here’s where you’ll learn about various math functions in Excel. You’ll use these to do things like aggregate data and determine averages.
Projects
There are no projects in Data Analysis in Excel. Rather, you’ll be working on a a steady stream of 48 mind-bending challenges within an Excel environment.
Community
DataCamp has a bustling community with a forum, tutorials, news and more.
💰 Price: $25 per month for all courses and Learning Paths / $33.25 per month for all courses, Learning Paths & projects
⏲️ Duration: 4 hours
📉 Level: Beginner
🖥️ Format: Interactive learning & video
🎖️ Certificate: Yes
🔥 Geena’s Hot Take
After taking countless courses, we think DataCamp’s challenges are second to none. They’re modern and fun, and can be solid additions to almost any portfolio.
What I appreciate most are the easy, short and very understandable video instructions, immediately followed by accessible exercises.
– Brian Baert, Student
Read our review to find out: Is DataCamp Worth It?
3. Exploratory Data Analysis in SQL: DataCamp
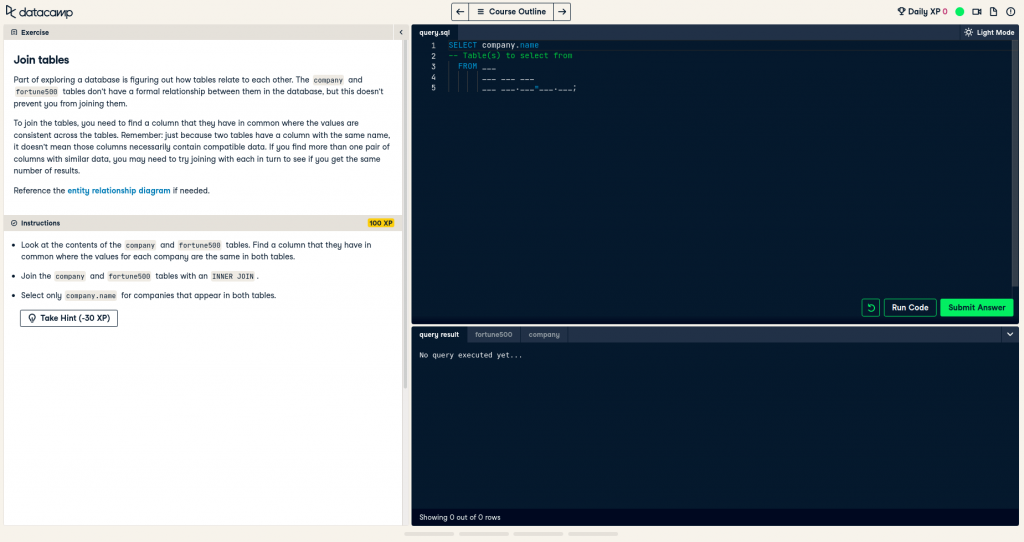
Exploratory Data Analysis in SQL is an intermediate-level SQL course on DataCamp.
And similar to Data Analysis in Excel, you’ll work on tons of interactive exercises. This keeps learning fun and engaging.
Using real-world data from Stack Overflow and Fortune 500 companies, you’ll become familiar with different data types:
- numeric
- character
- date/time
Using functions, you’ll learn how to aggregate, summarize and analyze data. You’ll also explore ways to clean up messy data.
By the end of Exploratory Data Analysis in SQL, you’ll be ready to discover PostgreSQL databases and analyze their data.
💡 PostgreSQL is an open source relational database management system. It extends the SQL language while combining it with features that store and scale workloads.
Course Layout
DataCamp has a gamified, interactive learning environment where you’ll do all work within the browser. You’ll also find videos to introduce or clarify concepts.
Exploratory Data Analysis in SQL is separated into four modules.
First, you’ll explore what’s in a database. Then, you’ll learn about summarizing and aggregating numeric data.
After that, you’ll discover categorical data and unstructured text.
Finally, you’ll learn how to work with dates and timestamps.
Projects
You’ll work on a whopping 58 in-browser exercises ranging from very easy to difficult in Exploratory Data Analysis in SQL.
Community
DataCamp has a complex community with a forum, tutorials and more.
💰 Price: $25 per month for all courses and Learning Paths / $33.25 per month for all courses, Learning Paths & projects
⏲️ Duration: 4 hours
📉 Level: Beginner
🖥️ Format: Interactive learning and video
🎖️ Certificate: Yes
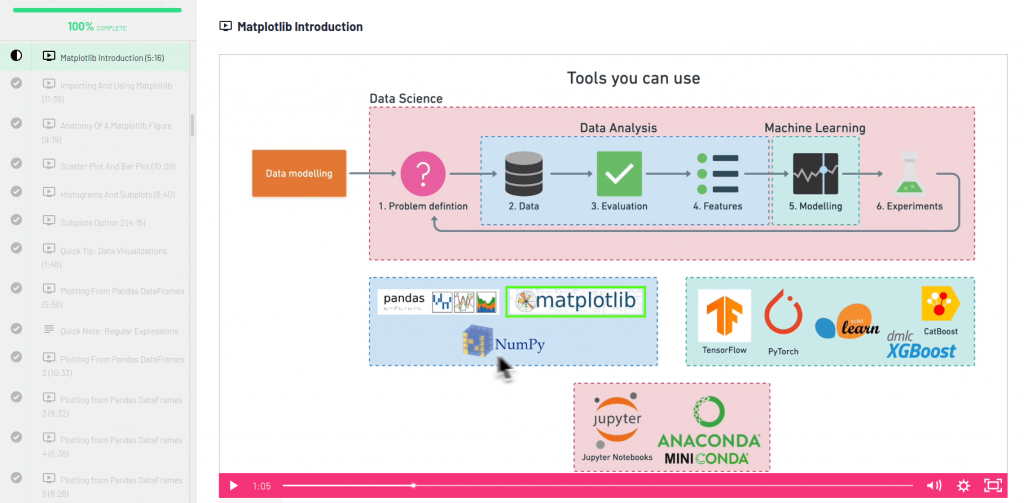
4. Complete Machine Learning and Data Science: Zero to Mastery
Andrei is one of the best teachers & his courses were a big reason I was able to get internships at both JP Morgan and Amazon.
– Justin Lin, Student
We love Zero to Mastery. With its bright illustrations and detailed explanations, instructor Andrei Neagoie can teach you just about anything.
Complete Machine Learning and Data Science is a little different than the other courses on our list of best data analysis courses.
Instead of strictly learning about data analysis, you’ll also learn about machine learning and data science.
💡 Data analysis, machine learning and data science are similar disciplines with overlapping concepts. Explore their similarities and differences here.
But today we’re just going to focus on data analysis.
Course Layout
Zero to Mastery is another video-based platform where you’ll do all work outside of the browser and in your own environment. But it’ll walk you through every step.
You won’t get a complete education on data analysis. Rather, you’ll learn about the tools used for data analysis such as:
- pandas
- NumPy
- scikit-learn
- Matplotlib
Each library has its own module with extensive coverage of its features and uses.
As we mentioned before, you won’t get a complete education on data analysis.
So we think Complete Machine Learning and Data Science should be used as a secondary resource for learning data analysis. Especially if you want to dive deeper into data analysis tools.
Projects
You’ll work on two portfolio-ready supervised learning projects in Complete Machine Learning and Data Science.
The first is related to classification, and the second project relates to time series data.
Community
Zero to Mastery has a bustling community including a LinkedIn group and Discord server where you can interact with instructors and other students.
💰 Price: $39 per month or $279 per year for all courses
⏲️ Duration: 42+ hours
📉 Level: Beginner
🖥️ Format: Video
🎖️ Certificate: Yes
Read our full Zero to Mastery Review.
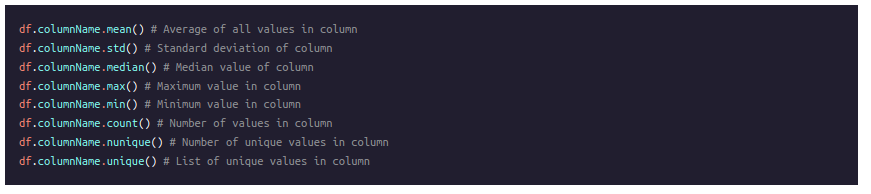
5. Learn Data Analysis with Pandas: Codecademy
If you’re like us and enjoy working on tons of interactive exercises, Codecademy Pro might have just the course for you.
Learn Data Analysis with Pandas is one of the best data analysis courses dedicated to learning the pandas library.
Here’s where you’ll discover tools for working with tabular data, data that’s in table form. Pandas is similar to SQL and Excel but harnesses the power of Python.

Course Layout
Codecademy has an interactive learning environment where you’ll do all work inside the browser.
Learn Data Analysis with Pandas contains three modules.
- Introduction to Pandas
- Aggregates in Pandas
- Multiple Tables in Pandas
First you’ll learn the fundamentals of pandas. Then you’ll learn how to ingest, clean and aggregate data.
After that, you’ll be able to use that data with Python modules such as SciPy and Matplotlib. You’ll also learn how to create pandas DataFrames and merge multiple tables.
Projects
You’ll work on a series of challenging mini-projects throughout Learn Data Analysis with Pandas.
Community
Codecademy has an active community where you can:
- get help
- share projects
- get answers to frequently asked questions
And more.
💰 Price: $39 per month or $239.88 per year for all courses and Learning Paths
⏲️ Duration: 6 Hours
📉 Level: Beginner+
🖥️ Format: Interactive learning & video
🎖️ Certificate: Yes
Read our full review: Is Codecademy Worth It?
6. Data Analyst Career Path: Codecademy
If you know you want a job as a data analyst, a Codecademy Pro Career Path might be the right choice for you.
Instead of one course, the Career Path Data Analyst has multiple. It’s meant to give you a complete education on data analysis and prepare you for an entry-level job.
The Data Analyst Career Path takes about 7 months to complete.
Career Path Layout
Codecademy is an interactive learning environment where you’ll do all work inside the browser. There are occasional videos to introduce or clarify concepts.
With 17 modules, you’ll learn about:
- Python fundamentals
- data acquisition
- data wrangling
- hypothesis testing
- data visualization
And much, much more.
Projects
In addition to multiple mini projects throughout the course, you’ll work on 4 major portfolio-ready projects:
- Data Visualization Portfolio Project
- Python Portfolio Project
- Data Analysis Portfolio Project
- Data Analyst Final Portfolio Project
Community
Codecademy has a busy community where you can get help from other students, share projects and more.
💰 Price: $39 per month or $239.88 per year for all courses and Learning Paths
⏲️ Duration: 7 months
📉 Level: Beginner
🖥️ Format: Interactive learning and video
🎖️ Certificate: Yes
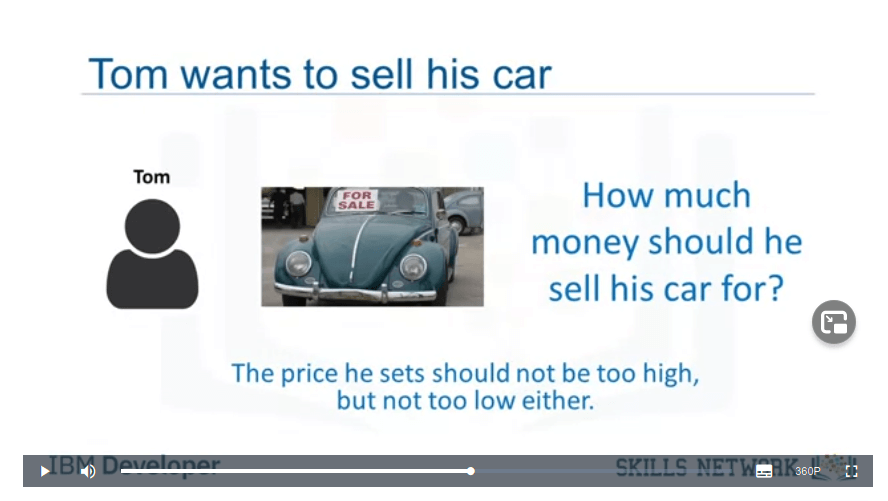
7. Data Analysis with Python: Coursera
Data Analysis with Python is a course on Coursera where you’ll learn how to analyze data using Python programming.
You’ll learn about:
- importing datasets
- cleaning data
- data frame manipulation
- summarizing data
And much more.
💡 Data cleaning is the process of detecting and fixing corrupt records from a database or table.
Course Layout
Coursera is primarily a video-based learning platform where you’ll do all work outside of the browser. But they offer step-by-step instructions to make sure you’re properly set up.
Data Analysis with Python has 7 week-long modules. Here’s where you’ll learn about:
- importing datasets
- exploratory data analysis
- model development and evaluation
And beyond.
At the end of the course, you’ll receive an IBM Digital Badge, the equivalent of a certificate.
Projects
You’ll work on a real-world real estate project.
Community
Coursera has a community where you can ask questions, get help, and chat with other students.
💰 Price: $39 per month
⏲️ Duration: 25 hours
📉 Level: Beginner
🖥️ Format: Video and interactive learning
🎖️ Certificate: Yes
8. Exploratory Data Analysis with R Learning Path: Pluralsight
Exploratory Data Analysis with R is a Learning Path on Pluralsight which takes a few a months to complete.
It includes some of the best data analysis courses using R programming.
You should be familiar with visualizing and importing data with R before taking this Learning Path.
Learning Path Layout
Pluralsight is a video-based learning platform where you’ll do all your work outside of the platform. But they have plenty of videos to walk you through setting up your own environment.
Exploratory Data Analysis with R contains two beginner and two intermediate courses:
- Exploring Your First Data Set with R
- Exploring Data Visually with R
- Designing an Exploratory Data Analysis Research Plan
- Exploring Data with Quantitative Techniques using R
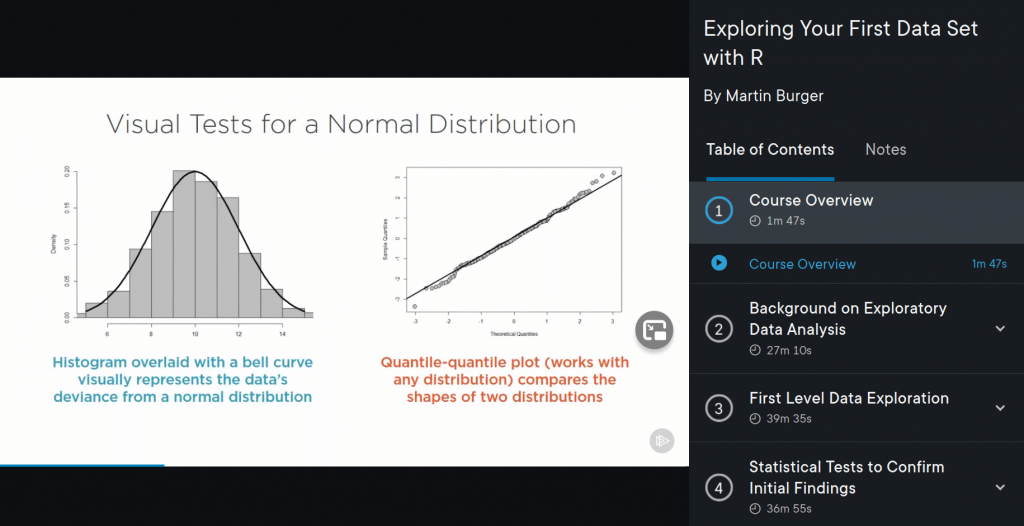
So after learning complex data sets, you’ll use various techniques to mine data and answer research questions.
Projects
You’ll work on various projects throughout Exploratory Data Analysis with R.
Community
There is no official community on Pluralsight, though they encourage students to form guilds.
💰 Price: $29 per month
⏲️ Duration: 7.75 hours
📉 Level: Beginner, Intermediate
🖥️ Format: Video
🎖️ Certificate: Yes
9. Data Analysis Basics: Treehouse
🚨 ALERT 🚨
As of September 2021, Treehouse has laid off 90% of its staff. The future of Treehouse is unknown.
Data Analysis Basics is a course on Treehouse meant to help you make better decisions with data.
You’ll learn what data analysis is and how to use it.
This course is very basic, so it’s one of the best data analysis courses for beginners.
We checked it out and recommend pairing it with an Educative.io or DataCamp course to give you a better understanding of data analysis.
Course Layout
Treehouse is a video-based platform, so you’ll do all of your work outside the browser.
Data Analysis Basics is separated into three modules.
First, you’ll learn how to analyze data to draw conclusions.
Then, you’ll get to know your data. Using a step-by-step process, you’ll use spreadsheets, charts and numbers to observe data.
Finally, you’ll become familiar with the data analysis process. Here’s where you’ll look at metrics to perform analysis of data.
Projects
There are no projects in Data Analysis Basics. Rather, you’ll work on setting up and becoming familiar with your data analysis environments and:
- charting your data
- analyzing the data
- presenting your findings
And beyond.
Community
Treehouse has a forum where you can get help from other students.
💰 Price: $25 per month
⏲️ Duration: 1.25 hours
📉 Level: Beginner
🖥️ Format: Video
🎖️ Certificate: No
I thrive in self paced online classes, so this was a perfect course platform for me.
– A W, Student
Best Data Analysis Courses This Year: Conclusion
Today we looked at the best data analysis courses for this year:
Best Overall
Data Analysis in Excel: DataCamp
Best for Newbies
Complete Machine Learning and Data Science: Zero to Mastery
Best Value
Python Data Analysis and Visualization Learning Path: Educative.io
So whether you’re looking for value, beginner-friendliness, or the best overall, we think there’s a data analysis course for just about everyone.
Up Next:
- 11 Best Python Machine Learning Books [Learn Machine Learning ASAP]
- 23 LeetCode Alternatives You Need This Year[Courses, Platforms, Books]
- 9 FAANG Interview Courses You Can’t Afford to Miss Out On [Get Hired at a FAANG]
- 9 Best Data Science Courses for Beginners [+4 Data Science Learning Paths]
- Data Science for Non-Programmers [Educative Course Review]
What are the best data analysis courses this year?
We picked three of the best data analysis courses for this year. Overall, we think Data Analysis in Excel by DataCamp is the way to go. For newbies, we recommend Complete Machine Learning and Data Science by Zero to Mastery. And for value, we think the Python Data Analysis and Visualization Learning Path by Educative.io is the best.What does a data analyst do?
A data analyst collects and stores data and brings technical expertise to ensure the quality of that data. Then they design and process it to help businesses make better decisions.
What is the best data analysis course for beginners?
Data Analysis Basics is a course on Treehouse meant to help you make better decisions with data. First you’ll learn what data analysis is and how to use it to create better results. This course is very basic, so it’s one of best data analysis courses for beginners.