Table of Contents
This post contains affiliate links. I may receive compensation if you buy something. Read my disclosure for more details.
TLDR: Best R Courses
Plus Skill Path and Specialization
Here are our top picks for best courses to learn statistics with R programming.
Courses
DataCamp: Introduction to Statistics in R – learn how to collect, analyze, and draw conclusions from data
DataCamp: Spatial Statistics in R – techniques to work with classes of statistical problems that present themselves with spatial data
DataQuest: Statistics Fundamentals in R – learn about techniques for sampling data, discreet and random variables, and different graph types
Skill Track
DataCamp: Statistics Fundamentals with R – learn concepts, topics, and techniques used by data scientists and statisticians
Specialization
Coursera: Statistics with R – learn statistical mastery of data analysis such as modeling, inference and Bayesian approaches
To jump right to the courses, use our Table of Contents above.
What is R programming?
R is a programming language and software environment. It’s used for statistical computing and graphics.
It’s mainly used by statisticians and data miners for data analysis and developing statistical software.
In addition, it’s extensible which means it can support add-ons and plug-ins that add functionality, particularly with user-submitted packages.
What is Statistics in R programming?
R provides a wide variety of statistics:
- linear and nonlinear modelling
- classical statistical tests
- time-series analysis
- classification
- clustering
And more.
So you’ll use the R environment for data manipulation, calculation and graphical display.
Statistics allow you to evaluate claims based on quantitative evidence and help you differentiate between reasonable and dubious conclusions.
– Jim Frost, author of Statistics by Jim
What are some uses of statistics?
Statistics are used in academic settings, healthcare, government and many other industries.
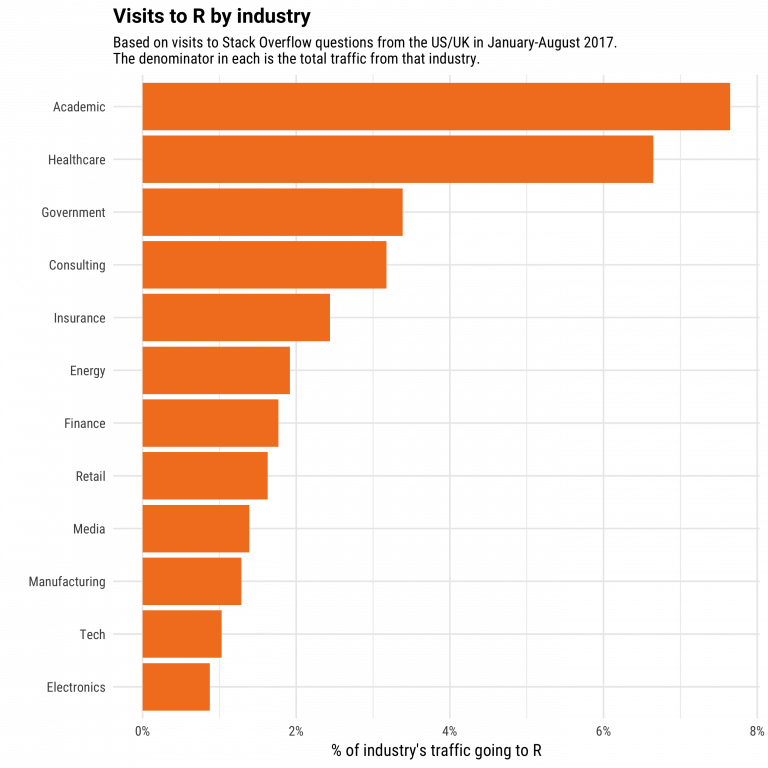
With these data visualizations, you can better understand data and trends.
Ok, now we have the basics. So let’s look at these R statistics courses.
R Statistics Courses
Courses generally give you a brief overview of the fundamentals and concepts of a technology. In this case, it’s statistics with R programming.
While they will teach you the basics, single courses do not provide a complete education.
But they’re great starting points.
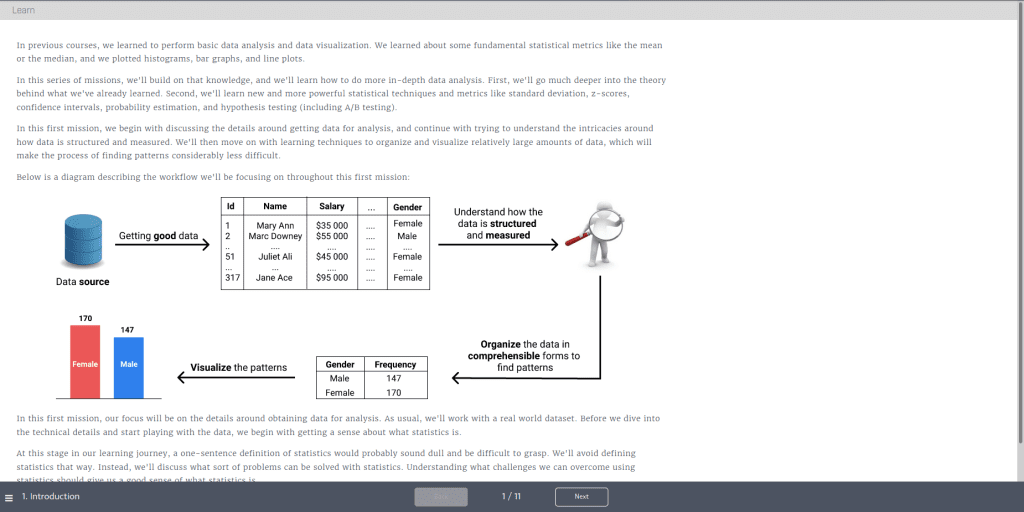
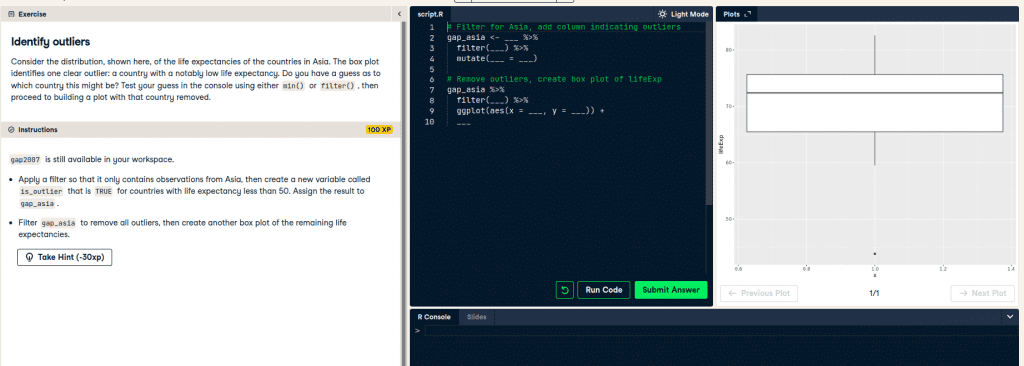
✨ DataCamp: Introduction to Statistics in R
⚠️ Level: Beginner
📖 Modules: 4
👨🏫 Learning style: Interactive text and video
📁 Projects: See below
⏲️ Estimated completion time: 4 hours
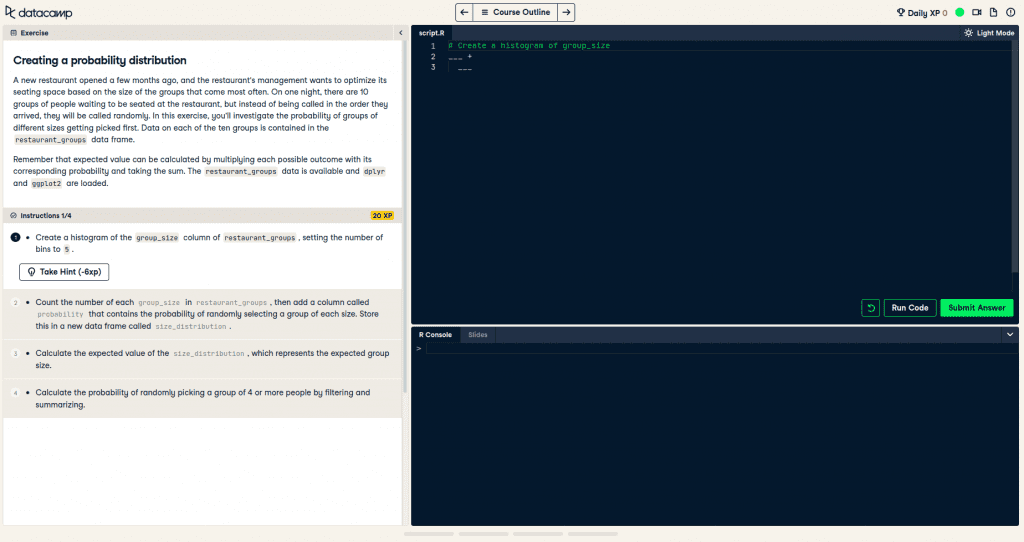
⌨️ Embedded code editor: Yes
🎮 Gamified environment: Yes
🎖️ Certificate of completion: Yes
In Introduction to Statistics in R, you’ll use sales data to:
- calculate averages
- use scatter plots to show numeric value relationships
- calculate correlation
And more.
In addition, you’ll learn how to navigate probability and how to conduct an organized study to draw your own conclusions from data.
🟢 Course Layout
Introduction to Statistics in R has 15 videos and 54 exercises.
And with 4 modules, you’ll learn:
✅ Summary Statistics – Explore mean, median and standard deviation, and choose the best summary statistics for your data.
✅ Random Numbers and Probability – Learn how to generate random samples and then measure chance by using probability.
✅ More Distributions and the Central Limit Theorem – Create histograms to plot distributions, then learn Poisson, exponential and t-distributions.
✅ Correlation and Experimental Design – Learn how to quantify the strength of a linear relationship between two variables, and see how a study’s design can change how data should be analyzed.
Takeaways:
By the end of Introduction to Statistics in R, you’ll have learned how to collect, analyze, and draw conclusions from data using R.
🟣 Projects
There are no projects in the course.
However, there are over a dozen R statistics projects on the DataCamp platform.
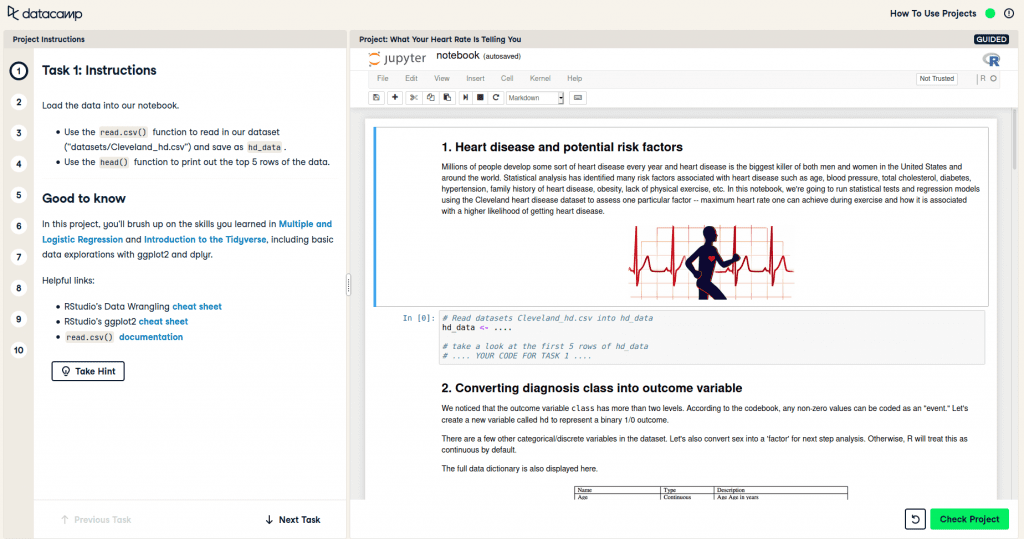
Some projects include:
- What Your Heart Rate Is Telling You
- Dr. Semmelweis and the Discovery of Handwashing
- Explore 538’s Halloween Candy Rankings
- Are You Ready for the Zombie Apocalypse?
Note: You’ll need a yearly subscription to access DataCamp projects.
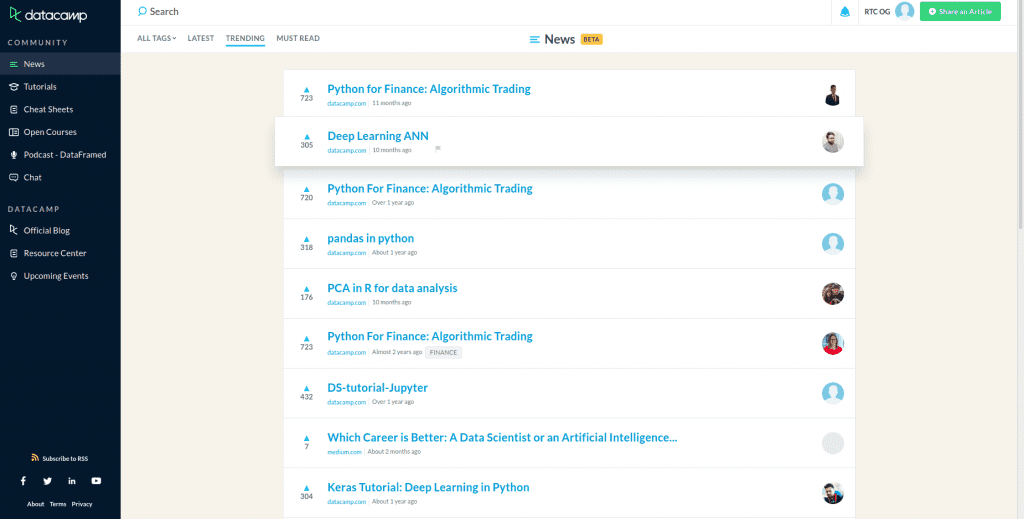
🟠 Community and Support
DataCamp has a robust community where you can chat with other students.
Plus there’s news, tutorials, a resource center and much more.
Support is available to yearly subscribers.
💰 Cost
You can get a monthly subscription to DataCamp for $25 per month. This includes all courses, skill tracks and career tracks on the platform.
However, you do not get access to projects with a monthly subscription.
You can get a yearly subscription for $33.25 per month. This will get you extras like projects and priority support.
Sign up for Introduction to Statistics in R
👉 here. 👈
✨ DataCamp: Spacial Statistics in R
⚠️ Level: Beginner
📖 Modules: 4
👨🏫 Learning style: Interactive text and video
📁 Projects: See below
⏲️ Estimated completion time: 4 hours
⌨️ Embedded code editor: Yes
🎮 Gamified environment: Yes
🎖️ Certificate of completion: Yes
According to urban legend (and Robert E. Williams), 80% of data is geographic. Location is a vital variable for things like disease outbreaks and traffic jams.
Spacial Statistics in R covers which statistical problem classes contain spacial data. Then you’ll learn what techniques you can use to work with them.
Note: While this is a beginner course, you should absolutely take an R statistics course before learning spacial statistics.
🟢 Course Layout
There are 16 videos and 60 exercises in Spacial Statistics in R.
And in 4 chapters, you’ll learn:
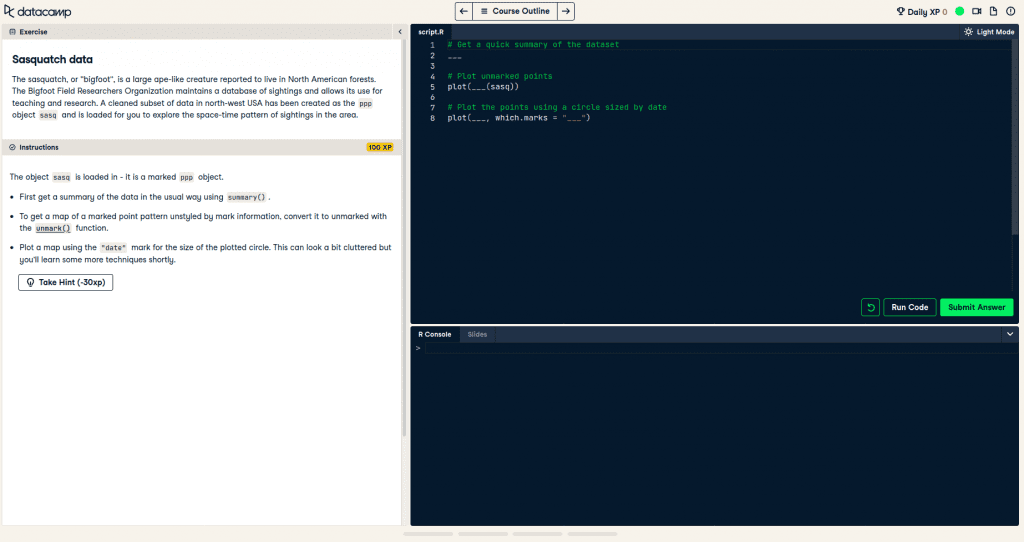
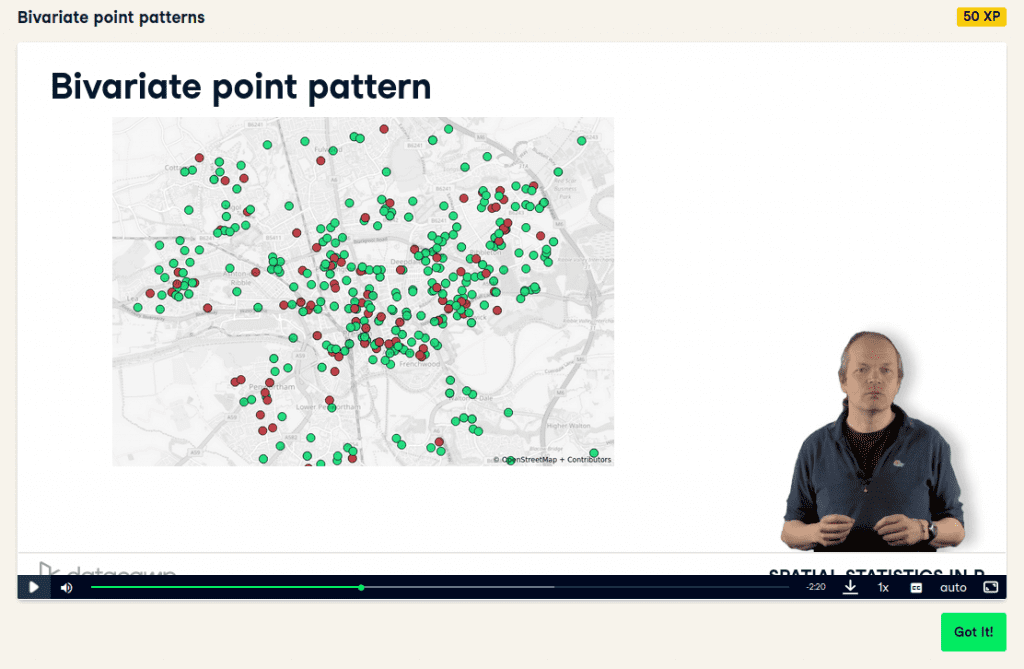
✅ Introduction – After a review of spacial statistics, you’ll learn about point pattern analysis.
✅ Point Pattern Analysis – Here you’ll work with different sets of data with point locations.
✅ Areal statistics – Learn specialized techniques of exploring data in administrative divisions.
✅ Geostatistics – Use location-based measurement data to enable model-based interpolation of measurements.
Takeaways:
By the end of this course, you’ll know how to extract meaningful insights from what you once saw as a mass of data points on a screen.
🟣 Projects
There are no projects in the course.
But there are over a dozen R statistics projects on the DataCamp platform.
Keep in mind that none that are specifically geared toward spacial statistics. However, they are still useful.
Note: You have to have a yearly subscription to access DataCamp projects.
🟠 Community and Support
DataCamp has a lively community where you can chat with other students.
And there’s news, tutorials, podcasts, a resource center and much more.
Support is only available to yearly subscribers.
💰 Cost
If you buy a monthly subscription to DataCamp it’s $25 per month. And this includes all courses, skill tracks and career tracks on the platform. But you won’t get access to projects.
Or there’s a yearly subscription for $33.25 per month. This includes extras like priority support and projects.
Sign up for Spacial Statistics in R
👉 here. 👈
✨ DataQuest: Statistics Fundamentals in R
⚠️ Level: Beginner
📖 Modules: 7
👨🏫 Learning style: Interactive text
📁 Projects: 1
⏲️ Estimated completion time: Unknown
⌨️ Embedded code editor: Yes
🎮 Gamified environment: No
🎖️ Certificate of completion: Yes
Statistics Fundamentals in R starts with an introduction to statistics and how it’s used in data science.
From there, you’ll learn techniques for sampling data such as cluster sampling and random sampling.
In addition, you’ll learn about discrete and random variables, different types of charts and graphs, and other concepts.
🟢 Course Layout
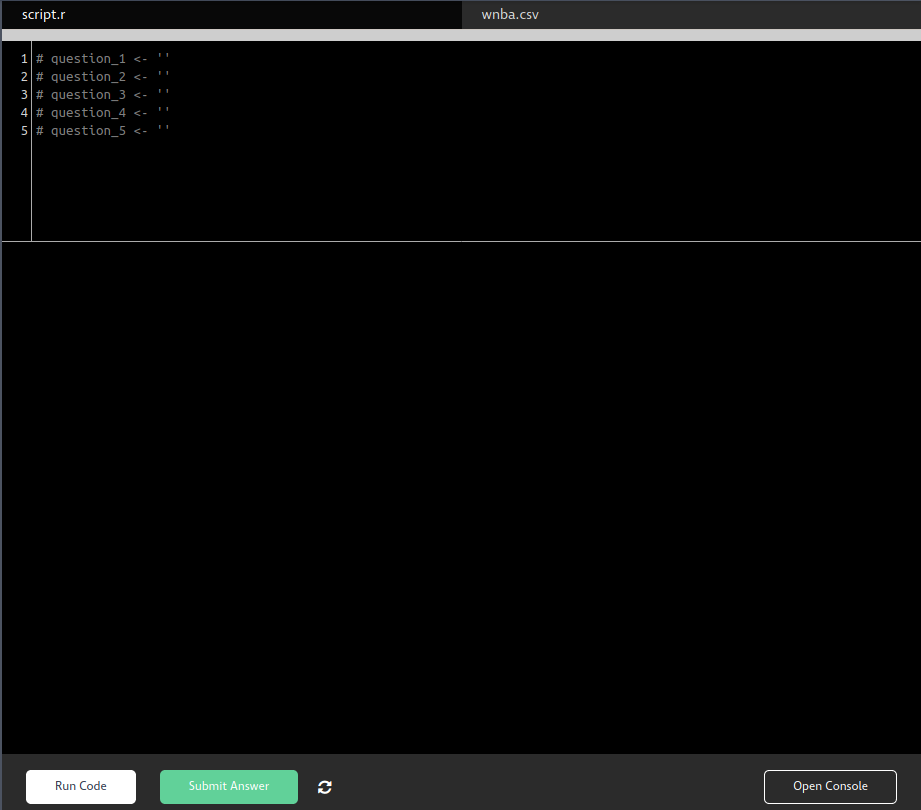
You’ll learn R statistics fundamentals using embedded code editor.
There are 7 modules which cover:
✅ Simple Random Sampling
✅ Stratified Sampling and Cluster Sampling
✅ Variables in Statistics
✅ Frequency Distributions
And more.
Takeaways:
By the end of this course, you’ll be able to understand variables in statistics, sample data using different methods, and compare frequency distribution tables.
🔥 Geena’s Hot Take:
There is valuable information in this course.
Buuuuut with the walls of text and clinical images it feels like you’re reading a textbook.
And the interactive code editor is simple to the point of being primitive.
🟣 Projects
You’ll work on one project: Investigating Fandango Movie Ratings.
Here you’ll use the skills presented in the course. In addition, you’ll overcome setbacks commonly found in data analysis.
🟠 Community and Support
DataQuest has a community where you can chat with other students, get answers to questions, read articles and more.
There’s also a DataQuest Support Center where you can submit help requests.
💰 Cost
You can join the DataQuest platform for $49 per month.
Or you can get a yearly subscription for $399 which give you extras like career coaching and resume reviews.
Sign up for Statistics Fundamentals in R
👉 here. 👈
R Statistics Skill Track
A skill track is a compilation of multiple courses to more deeply build your understanding of a specific technology.
In this case, you’ll learn the fundamentals and concepts of R statistics.
✨ DataCamp: Statistics Fundamentals with R
⚠️ Level: Beginner
📖 Courses: 5
👨🏫 Learning style: Interactive text and video
📁 Projects: 5
⏲️ Estimated completion time: 20 hours
⌨️ Embedded code editor: Yes
🎮 Gamified environment: Yes
🎖️ Certificate of completion: Yes
A strong foundation in statistics is key.
And in this track Statistics Fundamentals with R for beginners, you’ll use interactive text and video to learn about:
- R programming concepts, topics and techniques
- how to collect and analyze data
- correlation
And more.
Plus you’ll boost your statistics skills by working with real-world data.
🟢 Skill Track Layout
The Statistics Fundamentals with R skill track contains 5 courses:
✅ Introduction to Data in R – Learn about data, sampling strategies and experimental design.
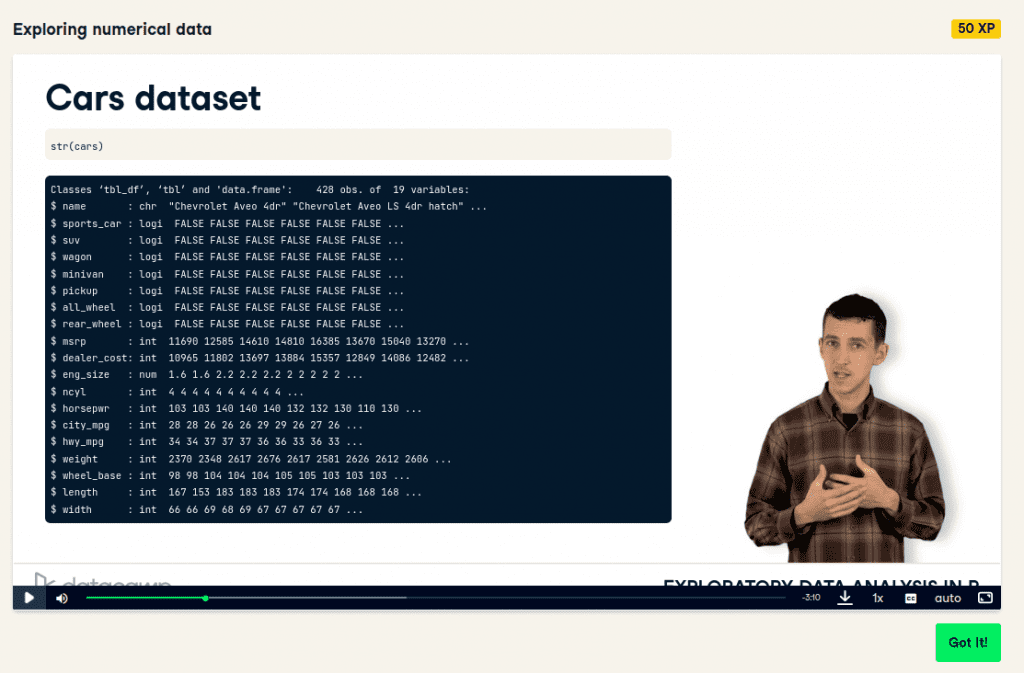
✅ Exploratory Data Analysis in R – Learn how to use graphical and numerical techniques.
✅ Correlation and Regression in R – Describe relationships between two numerical quantities.
✅ Multiple and Logistic Regression in R – Add multiple variables to linear models.
✅ Experimental Design in R – Learn about basic experimental design.
Takeaways:
🔥 Geena’s Hot Take:
If you’re looking to expand beyond fundamentals in statistics in R, this track is the way to go.
You’ll start with a basic R statistics course, then dive deeper into fundamental concepts.
This is arguably the best offering in this blog post.
🟣 Projects
There are no projects in the Statistics Fundamentals with R skill track.
However, there are over a dozen R statistics projects on the DataCamp platform.
Note: You must have a yearly subscription to access DataCamp projects.
🟠 Community and Support
DataCamp has a community where you can chat with other students.
Plus there’s news, tutorials, podcasts, a resource center and more.
Priority Support is only available to yearly subscribers.
💰 Cost
You can buy a monthly subscription to DataCamp for $25 per month. This includes all courses, skill tracks and career tracks on the platform. But you won’t get access to projects.
Otherwise, there’s a yearly subscription for $33.25 per month. This includes extras such as priority support and projects.
Sign up for Statistics Fundamentals with R
👉 here. 👈
R Statistics Specialization
A specialization on Coursera is similar to a skill track. But because it has multiple courses and a capstone project, it takes months longer to complete.
✨ Coursera: Statistics with R Specialization
⚠️ Level: Beginner
📖 Courses: 5
👨🏫 Learning style: Interactive text
📁 Projects: 5
⏲️ Estimated completion time: 7 months
⌨️ Embedded code editor: Yes
🎮 Gamified environment: No
🎖️ Certificate of completion: Yes
Statistics with R will teach you how to analyze and visualize data in R. In addition, you’ll create reproducible data, perform statistical inference and make data-based decisions.
🟢 Specialization Layout
With 5 courses, Statistics with R covers:
✅ Introduction to Probability and Data with R
✅ Inferential Statistics
✅ Linear Regression and Modeling
✅ Bayesian Statistics
✅ Statistics with R Capstone
Takeaways: You’ll walk away from this specialization with an understanding of R statistics. Plus you’ll have a portfolio project and a certificate to show for it.
🟣 Projects
You’ll work on a capstone data analysis project. This project is portfolio-ready. It covers statistical data analysis, inference, modeling and more.
🟠 Community and Support
Coursera has a community where you can chat with other students, find a study buddy, and search job forums.
💰 Cost
You can sign up for the Statistics with R Specialization for $49 per month.
Or you can sign up to the Coursera platform for $59 per month which will get you extra perks like additional courses, projects and assessments.
Note: Pricing is subject to change. Read more here.
Sign up for Statistics with R
👉 here. 👈
R Statistics Course: Conclusion
Today we showcased our top picks to learn statistics with R programming.
Courses
DataCamp: Introduction to Statistics in R – learn how to collect, analyze, and draw conclusions from data
DataCamp: Spatial Statistics in R – techniques to work with classes of statistical problems that present themselves with spatial data
DataQuest: Statistics Fundamentals in R – learn about techniques for sampling data, discreet and random variables, and different graph types
Skill Track
DataCamp: Statistics Fundamentals with R – learn concepts, topics, and techniques used by data scientists and statisticians
Specialization
Coursera: Statistics with R – learn statistical mastery of data analysis such as modeling, inference and Bayesian approaches
Need to learn R fundamentals before jumping into statistics?
Check out our 5 best R courses here.
What is the best R statistics course?
It depends. If you’re looking for a basic understanding of the fundamentals, then you may want to try: 1. DataCamp: Introduction to Statistics in R. 2. DataCamp: Spacial Statistcis in R. or 3. DataQuest: Statistic Fundamentals with R. However, if you need a deeper understanding of R statistics concepts, you may want to go the multi-course route with a skill track like DataCamp: Statistics Fundamentals with R or Coursera’s Specialization Statistics with R.
Where can I learn R statistics?
You can learn R statistics with books and videos, but we recommend taking a course. DataCamp uses a unique blend of interactive text, video and an embedded code editor to teach concepts. And DataCamp has two R statistics courses we highly recommend: Introduction to Statistics in R, and Spatial Statistics in R. If you’re interested in taking multiple courses, DataCamp has an R statistics skill track Statistics Fundamentals with R that contains five courses.
Is the Coursera Specialization Statistics with R worth it?
If you need to learn the fundamentals of R statistics and gain a firm understanding of R statistics concepts, Statistics with R is worth it. There are 5 chapters. You’ll start with an introduction to R statistics and build upon that foundation. Then you’ll work on a portfolio-ready capstone project that combines the skills you’ve learned from the courses.