![13 best data visualization books this year [learn data visualization now]](https://realtoughcandy.com/wp-content/uploads/2021/11/best-data-visualization-books-1024x576.jpg)
Table of Contents
Today we’re looking at the best data visualization books of this year.
🧠 Did you know? According to MIT, 90% of information that’s transmitted to the brain is visual.
What is data visualization?
Data visualization is the practice of translating data sets into visual mediums such as:
✅ charts
✅ maps
✅ graphs
This makes the information easier for the human brain to digest.
Data visualization is especially useful for larger sets of data which may otherwise be difficult to understand.
These visualizations enable you to share and examine real-time trends and insights about the information contained within the data.
Any of these look familiar?
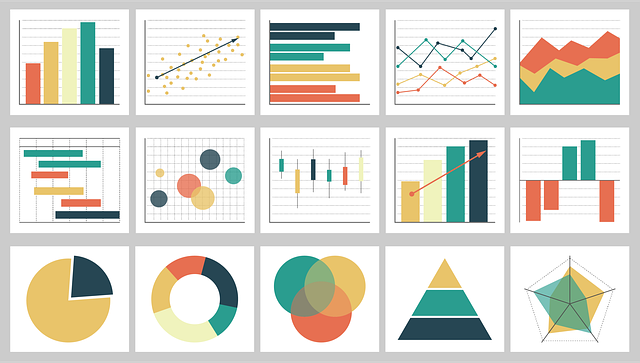
That’s right. They’re all data visualizations. 📈
What job uses data visualization?
Some jobs that use data visualization include:
✅ data visualization specialist
✅ data scientist
✅ data engineer
✅ business analyst
And beyond.
This post contains affiliate links. I may receive compensation if you buy something. Read my disclosure for more details.
TLDR: Best Data Visualization Books
🔥 Best Overall 🔥
Fundamentals of Data Visualization: A Primer on Making Informative and Compelling Figures
💥 Best for Newbies 💥
Data Visualization: A Practical Introduction
💸 Best Value 💸
Storytelling with Data: A Data Visualization Guide for Business Professionals
🧐 Best for Those with Data Experience 🧐
Better Data Visualizations: A Guide for Scholars, Researchers, and Wonks
Best Data Visualization Books
Now let’s take a look at the best data visualization books of this year.
1. Fundamentals of Data Visualization: A Primer on Making Informative and Compelling Figures
↘️ Ideal for: data visualization newbies and experts
↘️ Topics covered: fundamentals, redundant coding
Fundamentals of Data Visualization published by O’Reilly takes a practical approach to commonly occurring problems found in data visualization.
➡️ Fundamentals of Data Visualization is one of the best data visualization books for newbies and experts.
You’ll learn how to create visually delighting figures with guidelines and advice.
To do this, you’ll discover:
✅ basic concepts of color
✅ good and bad figures
And more.
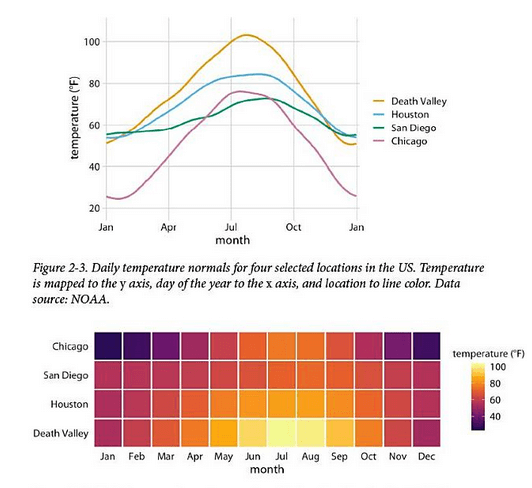
You’ll also explore the book’s visualizations directory which will show you commonly used data visualization types.
What data analysts are saying about Fundamentals of Data Visualization:
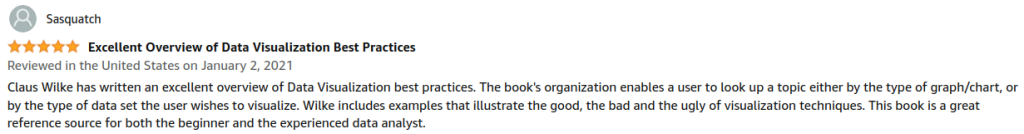
… This book is a great reference source for both the beginner and the experienced data analyst.
– Sasquatch, Data Analyst
2. Data Visualization: A Practical Introduction
↘️ Ideal for: data visualization newbies, researchers
↘️ Topics covered: fundamentals, R, ggplot2
Data Visualization: A Practical Introduction is a hands-on introduction to data visualization.
➡️ Data Visualization: A Practical Introduction is one of the best data visualization books for beginners.
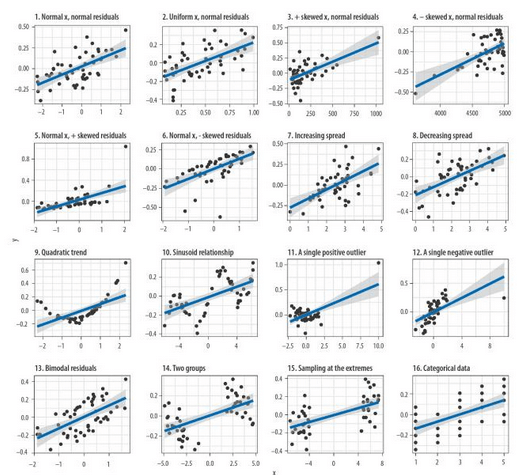
You’ll learn how:
✅ and why graphs succeed
✅ to use reproducible methods to create quality figures
✅ to effectively consider data visualization
More specifically, you’ll dive into ggplot2, an R programming visualization library.
Further, you’ll put your practical skills to use to create plots from start to finish.
3. Storytelling with Data: A Data Visualization Guide for Business Professionals
↘️ Ideal for: business professionals
↘️ Topics covered: storytelling, design, context
Storytelling with Data is pretty similar to Fundamentals of Data Visualization and Data Visualization: A Practical Introduction because you’ll learn data visualization fundamentals.
But with Storytelling with Data, you’ll learn how to elegantly craft your visualizations into a story you can communicate with your audience.
➡️ Storytelling with Data is one of the best-selling data visualization books for students on a budget.
You’ll go beyond the conventional methods of data visualization and hone in on ways to make your data informative and compelling.
You’ll discover:
✅ context
✅ the correct visualizations to use for your situation
✅ ways to eliminate clutter around your information
✅ how to think like a designer
Finally, you’ll learn how to utilize the power of storytelling in order to connect with your audience.
What those with data experience are saying about Storytelling with Data:
… I highly recommend this book to anyone looking to tell a story with their data.
– Alicia
4. Better Data Visualizations: A Guide for Scholars, Researchers, and Wonks
↘️ Ideal for: those with data experience
↘️ Topics covered: creating better graphs, dos and don’ts, visual perception
Better Data Visualizations is one of the hottest data visualization books on the market for those with data experience.
That’s because you’ll learn how to create more effective data visualizations with key strategies.
➡️ Better Data Visualizations is one of the best data visualization books for scholars and researchers.
For example, you’ll learn how to go beyond the standard line and pie charts and make more compelling graphs.
With over 500 examples, you’ll learn about:
✅ the dos and don’ts of data visualization
✅ principles of visual perception
✅ making style decisions for your charts
You’ll also find 80 visualizations all the way from histograms to choropleth maps.
What those with data experience say about Better Data Visualizations:
… It has so many examples and provides an incredible amount of information on how to present effective visuals…
– Cecelia
🔥 Geena’s Hot Take
If you’re someone experienced with data, Better Data Visualizations is THE next logical step to bring your visualizations to greatness.
5. Data Visualisation: A Handbook for Data Driven Design
↘️ Ideal for: those with data experience
↘️ Topics covered: data driven design
Data Visualisation: A Handbook for Data Driven Design is unlike any other book on our list because it focuses exclusively on data driven design.
➡️ Data Visualisation: A Handbook for Data Driven Design is one of the best data visualization books for those with data experience.
It will challenge your current approaches to creating data visualizations. You’ll discover effective and ineffective visualizations while professionally sculpting your judgment.
You’ll focus less on choice and more on tactics to manage your visualizations.
By the end of this book, you should be more confident in your approaches to data visualization.
6. Hands-On Data Visualization: Interactive Storytelling From Spreadsheets to Code
↘️ Ideal for: data visualization newbies
↘️ Topics covered: interactive charts, customized maps, drag-and-drop tools
Like Fundamentals of Data Visualization, Hands-On Data Visualization is published by O’Reilly. But this book is a little different.
No prior coding experience is required.
And instead of focusing on problems found in data visualization (and overcoming them), you’ll learn how to tell stories with your spreadsheets and code. So while both books are for for beginners, they’ll take you on entirely different learning paths.
➡️ Hands-On Data Visualization is one of the best data visualization books for exploring different data visualization tools.
This introductory text will teach you how to design customized maps and interactive charts using drag-and-drop tools like:
You’ll also explore editing open source code templates such as Leaflet and Highcharts.
7. Effective Data Visualization: The Right Chart for the Right Data
↘️ Ideal for: those with data experience
↘️ Topics covered: Excel charts and graphs
Effective Data Visualization is written by the data visualization guru Stephanie D. H. Evergreen. It’s for those with data experience who want to make their Excel data visualizations better.
➡️ Effective Data Visualization is a full-color how-to guide where you’ll learn how to create Excel graphs and charts that best communicate your data.
Backed by research and experience with clients, you’ll look at:
✅ quantitative graph types
✅ Excel shortcuts
✅ advice on using dashboards
And beyond.
This book is designed for you to jump around and hop in to the visualizations you want to improve.
8. Avoiding Data Pitfalls: How to Steer Clear of Common Blunders When Working with Data and Presenting Analysis and Visualizations
↘️ Ideal for: those with data experience
↘️ Topics covered: data-reality gaps, tools, common mistakes
Avoiding Data Pitfalls assumes that you are familiar with data visualization tools.
This book is meant to help those with data experience avoid the embarrassment of poorly presented data.
➡️ With Avoiding Data Pitfalls, you’ll learn how to create and present effective data visualizations.
You’ll be taken through the complete data visualization process including:
✅ calculating data
✅ analyzing data
✅ presenting data
Thus, you’ll learn how to use the right tools to streamline the process of data visualization.
9. Data Visualization Made Simple: Insights into Becoming Visual
↘️ Ideal for: data visualization newbies
↘️ Topics covered: fundamentals, strategies
Data Visualization Made Simple touts itself as a practical guide to all things data visualization:
✅ fundamentals
✅ strategies
✅ real-world cases
It’s a bit different than other books on our list because you won’t dive deep into tools.
➡️ Data Visualization Made Simple takes more of a hands-off approach to learning data visualization fundamentals.
First you’ll examine the role of data graphics. Then, you’ll learn how to scrutinize these graphics and discover visualization options.
Finally, you’ll discover ways professionals use data visualizations across multiple professions.
10. Data Visualization with Excel Dashboards and Reports
↘️ Ideal for: Excel users
↘️ Topics covered: data analyzing, data visualizing, Excel
Data Visualization with Excel Dashboards and Reports published by Wiley is similar to Effective Data Visualization because both focus exclusively on Excel.
But this book isn’t designed for you to hop around; it’s more linear.
➡️ Data Visualization with Excel Dashboards and Reports is one of the best data visualization books for Excel users.
First you’ll learn how to analyze large sets of data and look at data from different perspectives.
You’ll also learn how to:
✅ slice data into different views
✅ automate redundant reporting
✅ create dashboards
✅ visualize performance comparisons and trends
By the end of this book, you should understand the fundamentals of creating effective visualizations in Excel.
11. The Big Picture: How to Use Data Visualization to Make Better Decisions Faster
↘️ Ideal for: business professionals
↘️ Topics covered: data visualization basics
The Big Picture is geared towards business professionals.
➡️ The Big Picture shows you how to interpret visualizations.
You’ll explore visualizations in:
✅ Excel
✅ Tableau
✅ Power BI
✅ Qlik
And more.
You’ll learn the most effective methods for extracting information accurately so you can make proper decisions for your business.
12. Good Charts: The HBR Guide to Making Smarter, More Persuasive Data Visualizations
↘️ Ideal for: managers
↘️ Topics covered: building charts
Good Charts takes the responsibility of data visualization out of the hands of data scientists and into the hands of managers.
➡️ Good Charts is for managers who want to learn how to create visualizations.
In this guide, you’ll learn how data visualization works. You’ll also learn how to build charts by sketching and prototyping.
Finally, you’ll find quips and advice from data visualization professionals.
13. Cool Infographics: Effective Communication with Data Visualization and Design
↘️ Ideal for: data visualization newbies
↘️ Topics covered: infographics
With Cool Infographics, you’ll learn how infographics can be one of the most effective ways to display your data.
➡️ Cool Infographics is the only book on our list that uses infographics for data visualization.
In addition to learning the whys, you’ll explore tools and techniques for creating infographics.
You’ll also learn how businesses use infographics for:
✅ business plans
✅ marketing strategies
✅ annual reports
✅ board meeting presentations
And beyond.
Best Data Visualization Books: Conclusion
Now let’s recap this year’s data visualization book picks.
Today we looked at the best data visualization books including:
🔥 Best Overall 🔥
Fundamentals of Data Visualization: A Primer on Making Informative and Compelling Figures
💥 Best for Newbies 💥
Data Visualization: A Practical Introduction
💸 Best Value 💸
Storytelling with Data: A Data Visualization Guide for Business Professionals
🧐 Best for those with Data Experience 🧐
Better Data Visualizations: A Guide for Scholars, Researchers, and Wonks
So no matter what your data visualization needs, we think these are the best data visualization books of all time.
Developers are also reading:
- 12 Best Big Data Analytics Books This Year [Learn Big Data Analytics ASAP]
- 10 Best Big Data Books This Year [Learn Big Data ASAP]
- 5 Best Big Data Courses for This Year [Learn Big Data ASAP]
- 11 Best Data Analysis Books [Become a Data Analyst ASAP]
- 9 Best Data Analysis Courses [Become a Data Analyst Now]
What is data visualization?
Data visualization is the practice of translating data sets into visual mediums such as charts, maps and graphs. This makes the information it easier for the human brain to digest. It’s especially useful for larger sets of data which may otherwise be difficult to understand. These visualizations can enable you to share and examine real-time trends and insights about the information contained within the data. To learn more about data visualization concepts, be sure to check out today’s post where we look at the best data visualization books out there.
What are the best data visualization books?
In our opinion, the best data visualization books include our favorite overall, Fundamentals of Data Visualization: A Primer on Making Informative and Compelling Figures. For newbies, we like Data Visualization: A Practical Introduction. And for those on a budget, we chose Storytelling with Data: A Data Visualization Guide for Business Professionals. Finally, for those with data experience, we recommend Better Data Visualizations: A Guide for Scholars, Researchers and Wonks. To learn about these books and more, be sure to check out today’s post.
What job uses data visualization?
Some jobs that use data visualization include data visualization specialist, data scientist, data engineer, business analyst and beyond. To learn more about jobs that use data visualization, check out today’s article. We are looking at plenty of data visualization books for many different career types.
Which industry uses data visualization?
Some industries that use data visualization include construction, banking, government, healthcare and beyond. In today’s post, we’re looking at books where you can learn the ins and outs of data visualization. This includes top-rated bestsellers and more.
Is the book Better Data Visualizations worth it?
Yes, we think Better Data Visualizations is worth it. It’s one of the hottest data visualization books on the market for experienced data visualizers. That’s because you’ll learn how to create more effective data visualizations with key strategies. For example, you’ll learn how to go beyond the standard line and pie charts and make more compelling graphs. You can learn more about Better Data Visualizations and other data visualization books in today’s post.