Table of Contents
This post contains affiliate links. I may receive compensation if you buy something. Read my disclosure for more details.
TLDR: Introduction to Power BI
DataCamp Power BI Course Review
💥 Power BI is a tool for data analysis and data visualization.
💥 You don’t need technical or programming skills to use Power BI.
💥 DataCamp will teach you how to effectively use Power BI to you and your team’s advantage.
💥 You can also learn about other data visualization tools like Tableau and Oracle on DataCamp.
Sign up for Introduction to Power BI
👉 here. 👈
What is Power BI used for?
Power BI is a business analytics solution for visualizing data and sharing insights.
It’s used to simplify raw data into a user-friendly, understandable format.
Data comes in the form of dashboards and worksheets.
You can use these visualizations within your company or embed them in an app or website.
You do not need technical or programming skills to use Power BI.
So even non-technical users can take charge of Power BI spreadsheets.
Who uses Power BI?
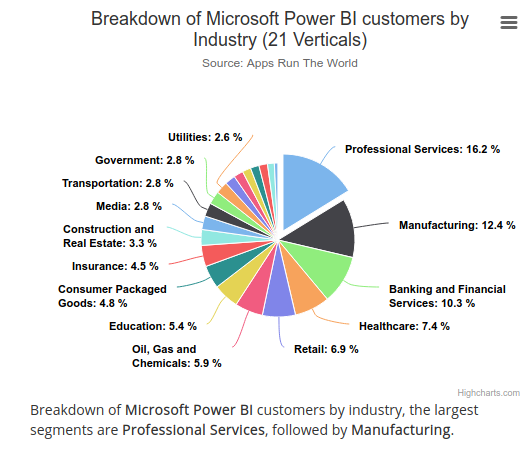
Power BI is used in various industries including government, transportation, insurance, manufacturing and healthcare.
Some companies that use Power BI include 7-Eleven, 3M Company, and 20th Century Studios.
✨ DataCamp Power BI Course: Introduction to Power BI
⚠️ Level: Beginner
📖 Chapters: 3 with 55 exercises
👨🏫 Learning style: Interactive text and 19 videos
⏲️ Estimated completion time: 4 hours
🎮 Gamified learning environment: Yes
Introduction to Power BI will teach you:
✅ how to load and transform data using Power Query
✅ the importance of data models
✅ how to create data visualizations using drag-and-drop functionality
✅ how to make reports fully interactive
✅ Data Analysis Expressions (DAX) to create customized columns and fields
And at 4 hours, you and your team can take the course in half a work day.
DataCamp Power BI Course Content
Now let’s dig a little deeper and see what these 4 chapters have to offer.
Chapter I: Getting Started with Power BI
In this chapter, you’ll learn about Power BI fundamentals like:
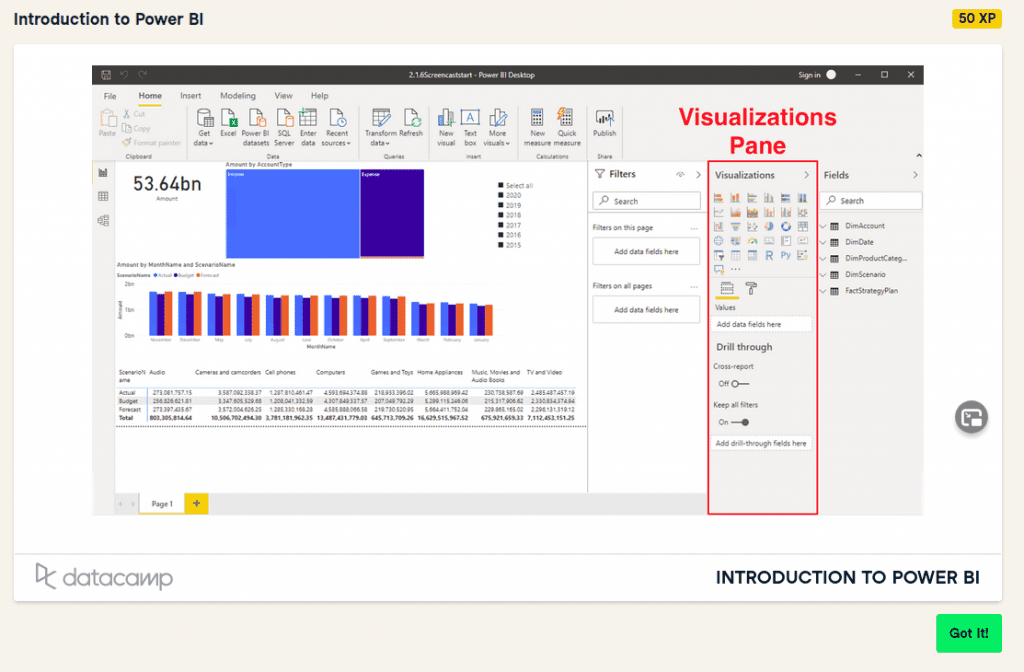
- how to navigate Power BI’s data, model and reports
- loading multiple datasets and building a data model
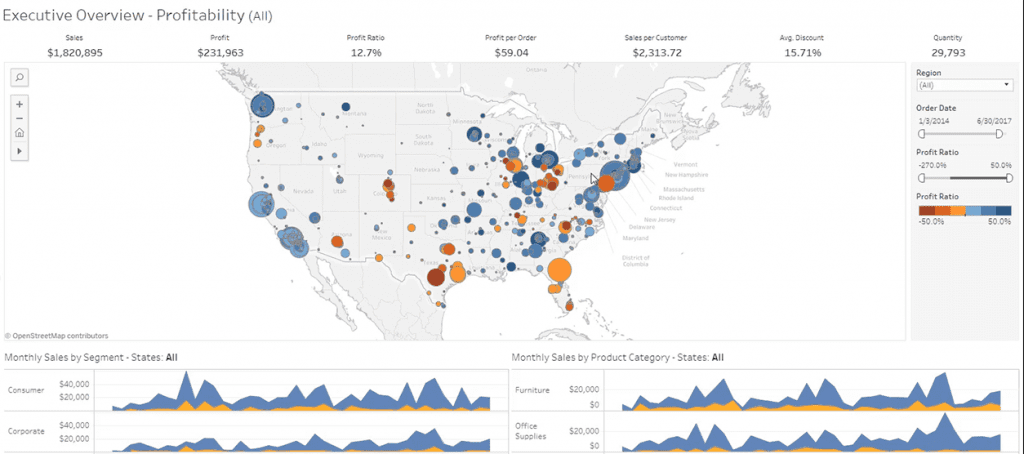
- creating bar graphs and map visualizations
And much more using the Power Query Editor.
Takeaways
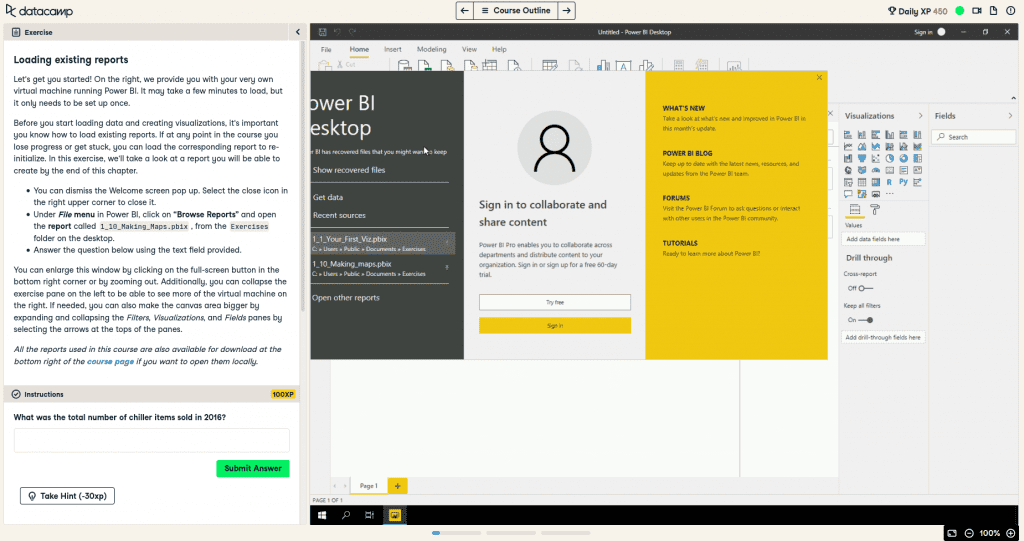
By the end of this chapter, you’ll know how to load existing reports, clean data, transform and format columns, and navigate Power BI.
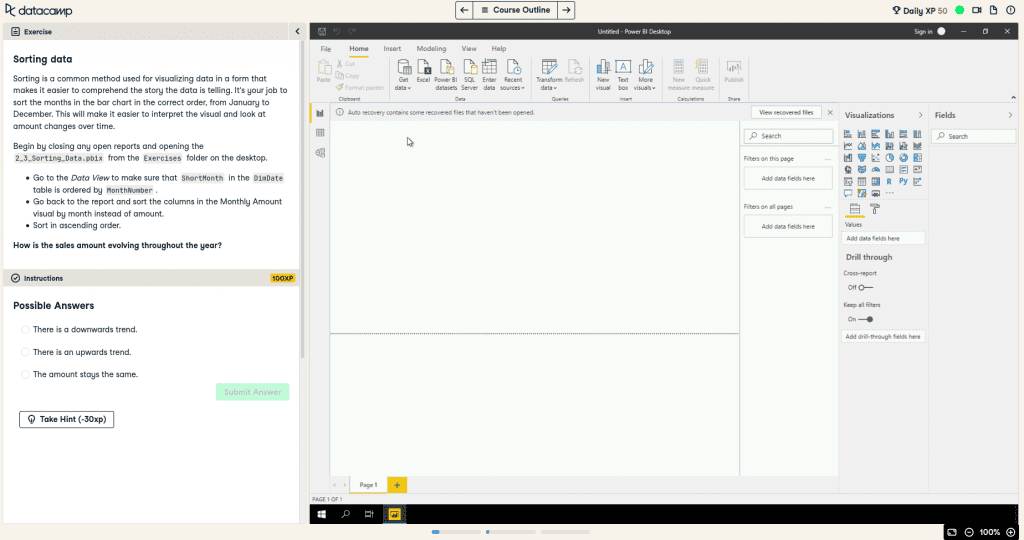
Chapter II: Visualizing Data
In the chapter Visualizing Data, you’ll learn how to:
- change and format visualization
- sort data and create hierarchies
- filter information in reports by location
And beyond.
Takeaways
By the end of this chapter, you’ll be familiar with editing properties, turning off interactions and applying advanced filtering.
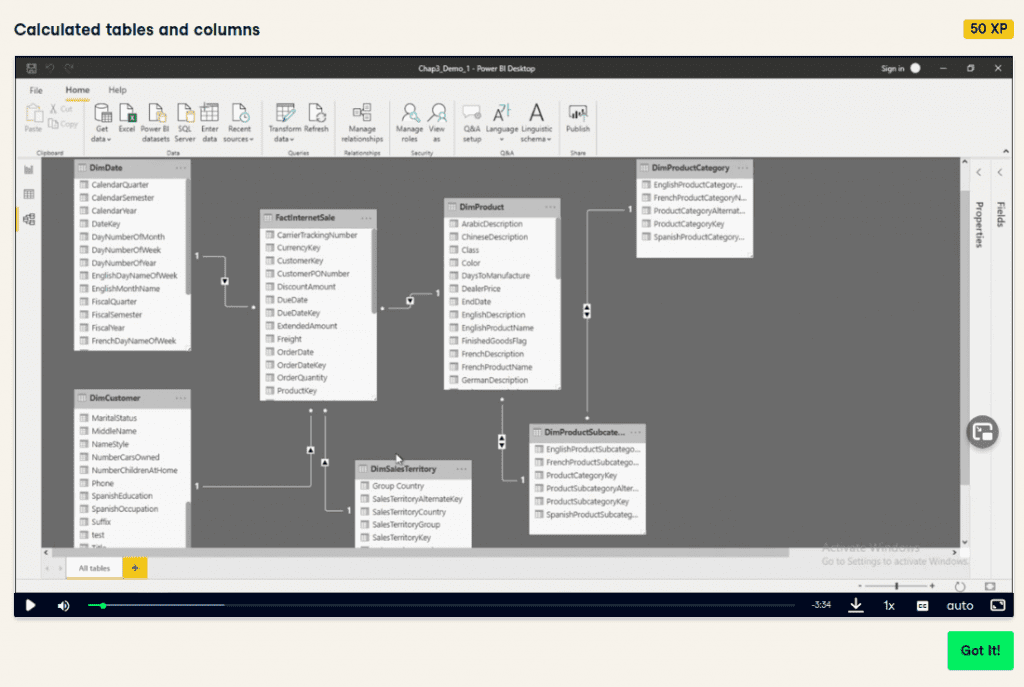
Chapter III: Creating Calculations with DAX
In the final chapter, you’ll learn how to create customized calculations using Microsoft’s Data Analysis Expressions (DAX).
DAX is a collection of functions and operators that can be used in a formula to calculate and return values.
So basically, DAX helps you create new information from existing data.
Using DAX, you’ll:
- create calculated columns and tables
- write calculated measures
- leverage Power BI’s Quick Measures
And then you’ll create complex DAX calculations.
Takeaways
At the conclusion of this chapter, you’ll be able to generate passwords, count product, calculate year over year profits and more.
🤝 Community and Support
DataCamp has a robust community where you can read news, chat with other students and more.
DataCamp features Priority Support with a yearly subscription. With Priority Support, you’ll be able to get help from experts.
💰 Cost
Introduction to Power BI is only available for paid subscriptions to DataCamp:
Premium Personal Plan – Access to exclusive Power BI, Oracle and Tableau content for $33.25 per month
Enterprise Business Plan – Exclusive Power BI, Oracle and Tableau content. Price is per user or hourly cost
Sign up for the DataCamp course Introduction to Power BI
👉 here. 👈
What’s the difference between Power BI and Tableau?
Both Power BI and Tableau are used to help users understand and visualize data.
Power BI is heavy on data manipulation, then gets into data visualization. However, it can only handle a limited volume of data.
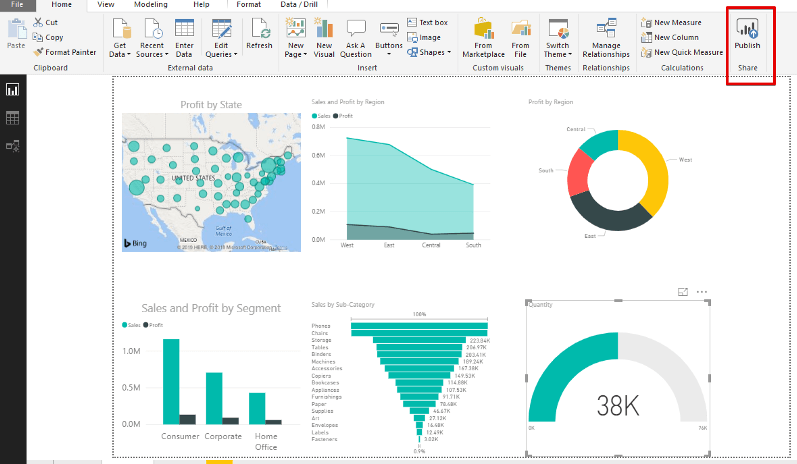
Tableau is better known for its data visualization functionality. It handles a larger amount of data with increased performance.
Both are user friendly.
But Power BI feels a little more clinical due to how much time is spent organizing raw data. This is done using Excel tools like Pivot Tables, slicers and charts.
What is the best way to learn Power BI?
There are plenty of places to learn how to use Power BI including blogs, webinars, books and community resources.
However, we recommend the DataCamp Power BI course Introduction to Power BI.
This course uses videos to explain Power BI concepts. And then you’ll immediately work on interactive exercises to implement your new skills.
Introduction to Power BI can be used to teach yourself or use as a training tool for your team.
DataCamp Power BI Course: Conclusion
So, is the DataCamp Introduction to Power BI course worth it?
If you need a user-friendly tool to convert your data into understandable data visualizations, then Introduction to Power BI is for you.
✅ Power BI is a tool for data analysis and data visualization.
✅ You don’t need technical or programming skills to navigate Power BI.
✅ DataCamp will teach you how to use Power BI to your and your team’s advantage.
And remember, you can also learn about other data visualization tools like Tableau and Oracle on DataCamp.
Sign up for Introduction to Power BI
👉 here. 👈
Not sure if Power BI is for you?
We have plenty of different course reviews. For example, we review DataCamp’s Introduction to Tableau. It’s similar to Power BI and might be more your speed. Read our full review here.
Is the DataCamp course Introduction to Power BI worth it?
If you’re looking for a user-friendly tool to convert your data into understandable data visualizations, then Introduction to Power BI is for you. You don’t need technical or programming skills to navigate Power BI, so even non-technical users can take charge of Power BI spreadsheets. And because it’s only 4 hours, you and your team can take the course in half a work day.
What’s the difference between Power BI and Tableau?
Power BI and Tableau are both user friendly, but there are a few differences. Power BI relies heavily on data manipulation, then gets into the data visualization. However, compared to Tableau, it can only handle a limited volume of data. Tableau is better known for its data visualization functionality. It can handle a larger amount of data and has increased performance.
What’s the best way to learn Power BI?
There are many places to learn Power BI including blogs, webinars, books and community resources. But we recommend the DataCamp Power BI course Introduction to Power BI. This course uses videos to explain beginner Power BI concepts. From there you’ll work on interactive exercises to implement your new skills. This course can be used to teach yourself or use as a training tool for your team.